Last Updated on October 10, 2023 by Adil
Introduction:
Canva infographics are a powerful tool for creating eye-catching visuals that help you quickly and easily communicate data, information, and ideas. With Canva’s intuitive design tools and resources, anyone can create professional-looking infographics in minutes. Whether you’re creating an infographic for a business presentation or your blog, there are some key steps to follow when designing with Canva pro apk.
Choose Your Topic:
Before launching into the design process, determine the purpose of your infographic and what you want it to communicate. Once you have a clear goal in mind, it will help guide your selection of colors, fonts, images, and content elements during the design phase.
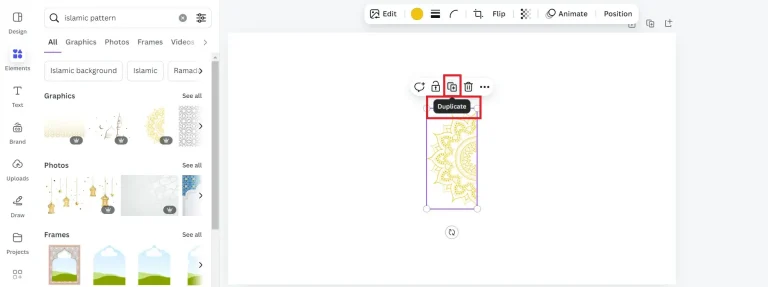
Line Up Your Layout:
To give your infographic structure and flow, use the Canva grid system to arrange content elements visually appealingly. Experiment with different layouts until you find the one that best showcases your topic and creates an intuitive experience for your readers.
Organize Your Infographic Content:
Once you have finalized the layout, fill it with relevant content using words, numbers, visuals, or any combination of those. Remember that each element should build on the other so as not to jump abruptly from one topic to another.
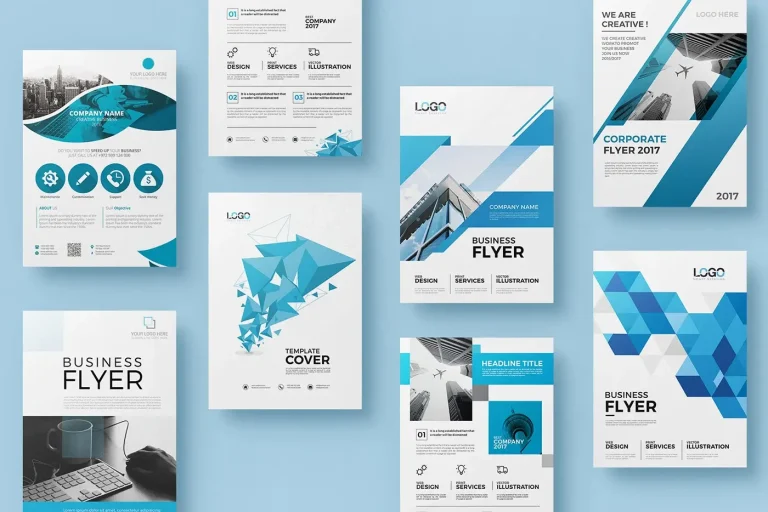
Choose Your Colors:
Colors carry meaning and emotion, so it’s important to select colors wisely. Certain hues can evoke feelings or associations within viewers and, therefore, should be chosen based on the message you want to deliver.
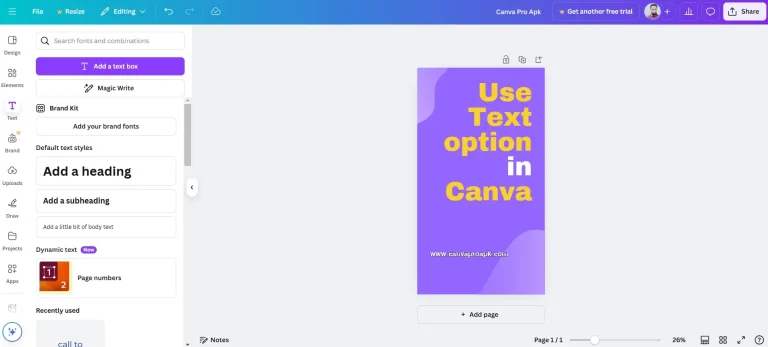
Choose Your Font:
Typography is an important element of any graphic design. After all, fonts are how you deliver your message to users and help establish a visual hierarchy. Canva offers many different font choices, so choose one that reflects the tone of your message and fits in with the overall look of your infographic.
Infographic elements:
Infographic elements like charts and graphs make the information easier to comprehend and process. By utilizing different colors and shapes, you can draw attention to the most important points on your infographic. You can add icons or other images to emphasize key facts or points. And with Canva’s drag-and-drop feature, it’s easy to move elements around until they look perfect.
Charts & Graphs:
Canva’s customizable charts and graphs allow you to display data while accurately keeping your infographic visually appealing. Choose from various chart styles and colors to represent your data clearly, then add special touches like labels, arrows, or lines for added emphasis. With Canva’s easy-to-use features, you can create stunning graphs that will impact any audience.
Social Media Sharing:
Once you’ve finished creating your infographic, it’s time to make it social media-ready! Add images and captions to draw attention to specific design elements, then share them across all major platforms with your followers. Thanks to Canva’s convenient sharing options, you can spread the word quickly and efficiently.
Creating infographics with Canva is fast, easy, and affordable – and best of all? You don’t need any design experience to get started. Whether you need something for work or school, social media, or just for fun, Canva infographics are the perfect way to communicate data and information in a visually appealing way.
Conclusion:
In conclusion, Canva’s infographic tools make it easy for anyone to create professional-looking visuals that are easily shared on multiple platforms. With its eye-catching charts and graphs, customizable elements, and easy-sharing options, Canva is perfect for creating stunning infographics in minutes. So why not give it a try? Let your creative side shine and start designing your incredible infographic today!